Beyond the Hourly Rate: The True Cost of a Hospital Workforce


Most hospital workforce decisions start with a simple comparison. An agency nurse costs one rate per hour. A staff nurse costs another. The lower number appears to win, which is understandable when workforce represents roughly 60% of the average hospital's total expenses.
Hospitals spent more than $1 trillion on their people in 2025, according to the American Hospital Association’s Costs of Caring 2026. At this scale, every workforce decision deserves close financial scrutiny.
The problem, however, is that hourly rate captures only part of the financial impact. A staffing decision can affect overtime, turnover, capacity, length of stay, readmissions, quality, and reimbursement. Those costs can show up across the organization, far from the labor cost center where the original decision was made.
For hospital CFOs, the better question is simple: What did the staffing decision actually cost the organization?
Hospital Labor Costs Are More Than the Hourly Rate
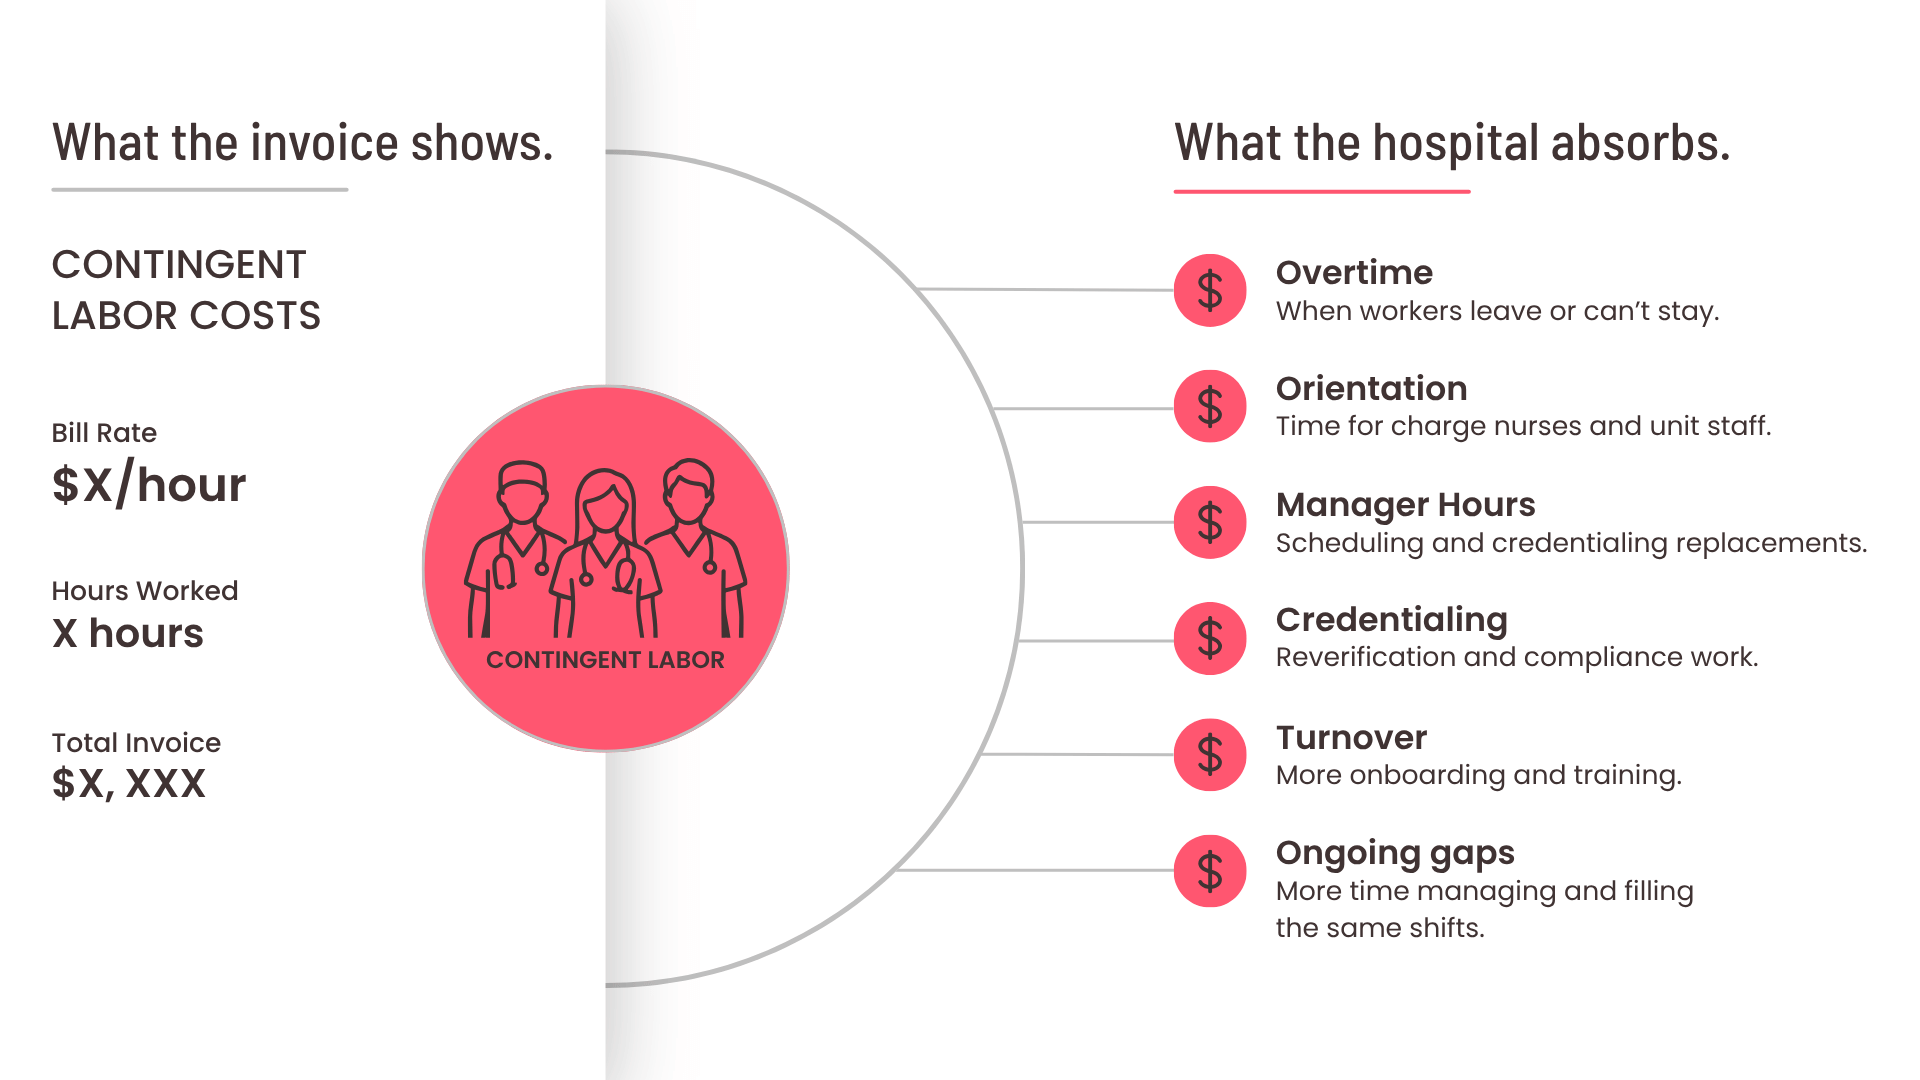
Start with the costs you can see. Bill rates, base wages, overtime, agency markups, differentials, recruiting, and other direct expenses appear in the labor budget or on the invoice.
Then consider the costs that are harder to connect to a staffing decision. Vacancies can reduce capacity. Turnover can increase overtime and recruiting costs. New workers require orientation and training. Changes in staffing can also affect length of stay, readmissions, patient safety, and reimbursement.
Looking at both gives your finance team and other leaders a more complete view of staffing cost. It also creates a better foundation for comparing different workforce models.
Why Bill Rate Doesn't Tell the Whole Story
Contingent labor makes the gap especially easy to see. Healthcare organizations often compare agencies by bill rate. Agency A charges one rate, Agency B charges another, and the lower rate gets reported as savings. But what happens after the shift is filled?
A lower bill rate may still come with higher turnover, more overtime, repeated orientation, or additional administrative work. Managers may spend more time recruiting and credentialing replacements. Charge nurses may repeatedly orient new workers who don't stay.
These costs don't appear on the agency invoice. They show up elsewhere in the organization. Therefore, healthcare labor cost management improves when finance connects the bill rate to the broader costs associated with the hospital's workforce model.
What Is the Total Cost of Hospital Staffing?
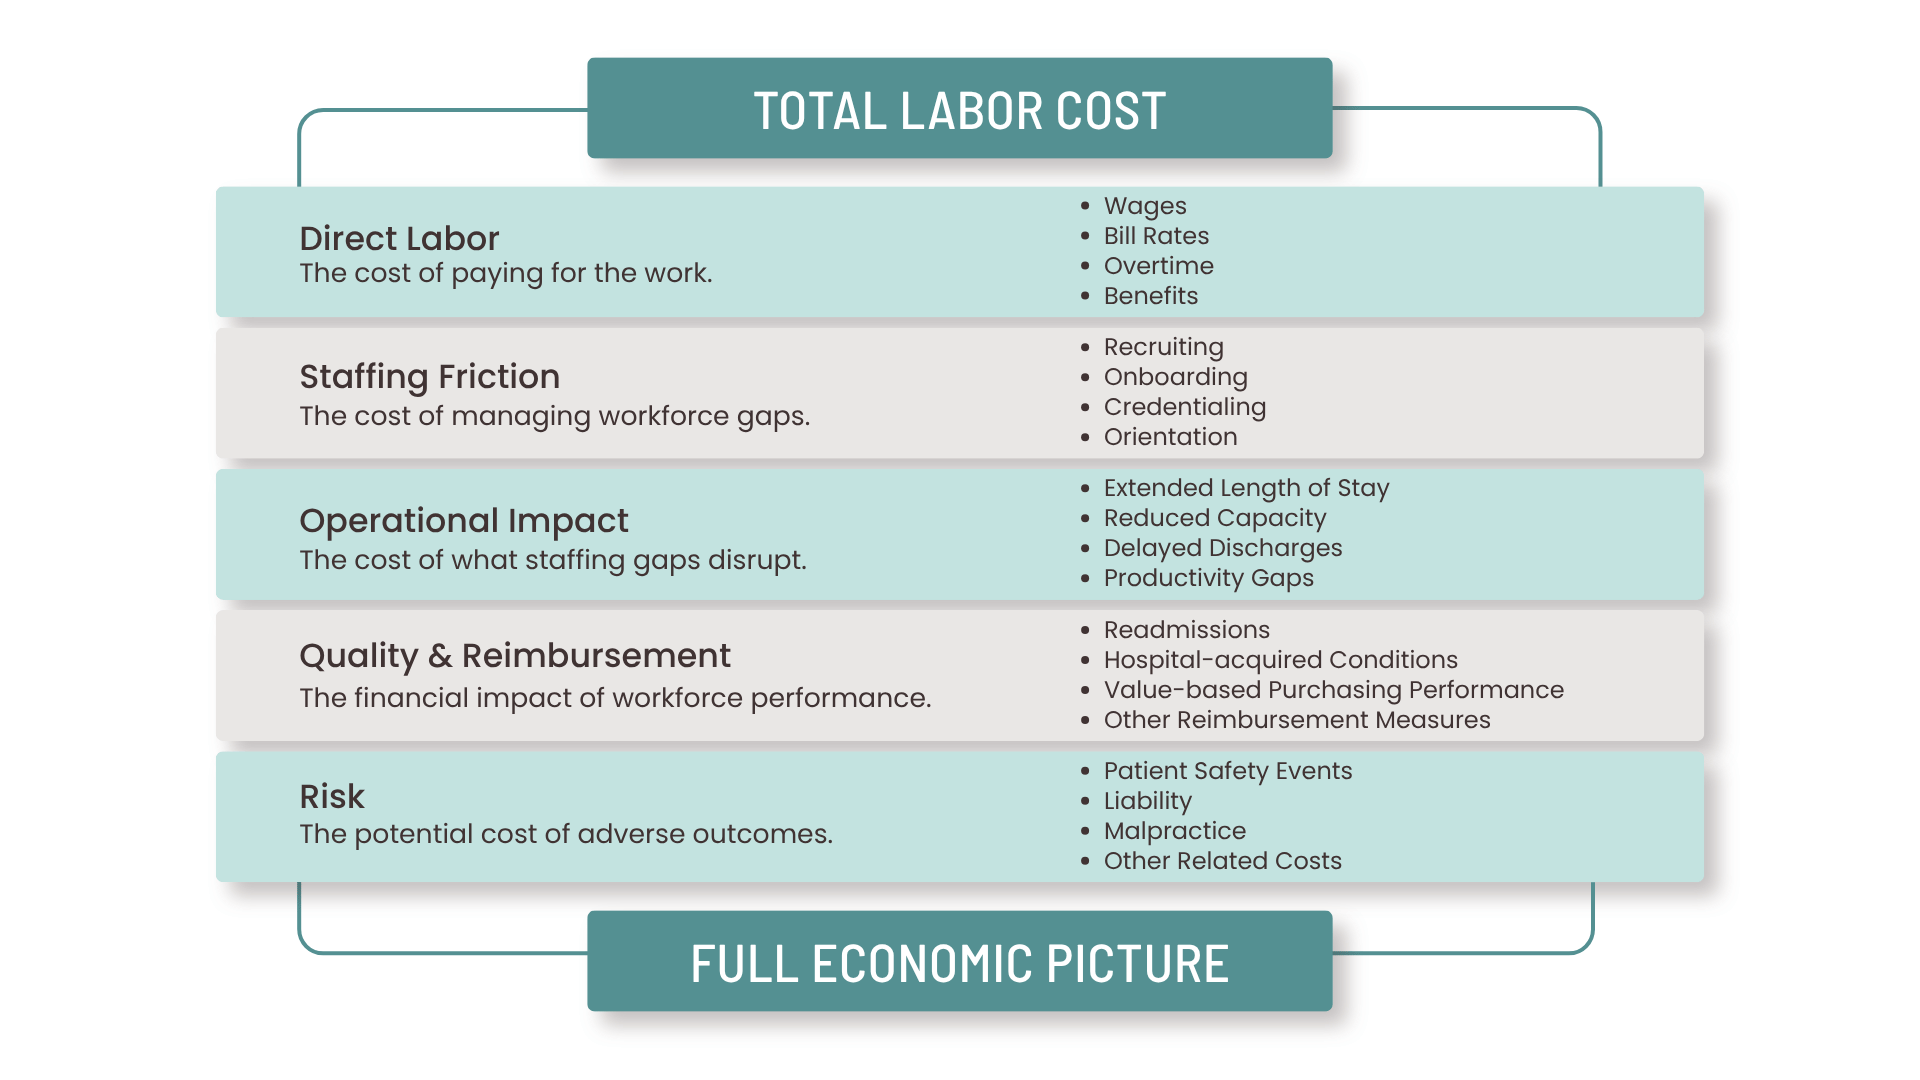
The true cost of hospital staffing goes beyond wages and bill rates. It also includes the costs that follow from how you staff your workforce. A simple way to look at it is:
Direct Labor + Staffing Friction + Operational Impact + Quality & Reimbursement Impact + Risk = Total Staffing Cost
It's a practical framework, rather than a standard accounting formula, for looking at the full cost of a staffing decision.
Direct labor: Wages, bill rates, agency markups, overtime, differentials, employer taxes, and benefits.
Staffing friction: Recruiting, onboarding, credentialing, orientation, vacancies, turnover, and scheduling inefficiency.
Operational impact: Longer stays, reduced capacity, delayed discharges, productivity gaps, and vacancy-driven overtime.
Quality and reimbursement: Readmissions, hospital-acquired conditions, value-based purchasing performance, and other factors that can affect reimbursement.
Risk: Patient safety events, liability, malpractice, and other costs tied to adverse outcomes.
Looking at all five categories gives you a clearer picture of what each workforce model actually costs and where those costs show up across the organization.
The Hidden Cost of Understaffing in Hospitals
Understaffing rarely appears as a line item called "understaffing cost." The financial effects spread across departments, making it harder to connect them to the original staffing decision.
The clinical consequences can also be significant. Aiken and colleagues found that each additional patient added to a nurse's workload was associated with a roughly 7% increase in the odds of patient death within 30 days in their study published in JAMA.
The financial path from a staffing gap to an organizational cost can look like this:
Workforce Issue | Downstream Impact | Where CFOs See It |
|---|---|---|
Vacancy | Overtime & Agency Use | Labor |
Turnover | Recruiting & Onboarding | HR & Workforce |
Insufficient Coverage | Length of Stay & Throughput | Operations |
Patient Safety Events | Treatment & Liability | Quality & Risk |
Readmissions | Reimbursement Impact | Revenue |
Poor Quality | Payment Adjustments | Revenue |
Lack of Continuity | Operational Inefficiency | Multiple Cost Centers |
A coverage gap that starts on one unit can eventually affect operations, care quality, hospital revenue, and patient safety. Connecting those effects provides a clearer picture of what understaffing costs the organization.
How Nurse Turnover Changes Workforce Economics
Nurse turnover creates costs well beyond the recruiting bill. Replacing an experienced RN can require recruiting, temporary coverage, orientation, onboarding, and months of productivity ramp-up.
The 2026 NSI National Health Care Retention & RN Staffing Report estimates the average cost of turnover for a staff RN at approximately $60,090. The report also estimates that a one-percentage-point change in RN turnover costs or saves the average hospital approximately $295,000 annually. At a national RN turnover rate of 17.6%, NSI estimates that annual turnover costs the average hospital about $5.19 million.
Turnover also takes institutional knowledge out of your organization. New workers need time to learn workflows, technology, escalation procedures, team dynamics, and the specific requirements your facility.
Why Repeat-worker Continuity Has Economic Value
Repeat-worker continuity can reduce some of the friction associated with contingent labor. Workers who already know the facility can spend less time learning basic workflows and more time contributing to the unit.
The effect can extend to the workforce team as well. Familiar workers require less orientation, managers spend less time introducing new people to the unit, and scheduling teams can build around workers who've already demonstrated their ability to work in the environment.
For example, ShiftMed’s workforce model follows a defined coverage sequence. It starts with qualified internal staff, including core, PRN, and float clinicians, before turning to local on-demand W-2 clinicians. Agency labor comes last when internal and local capacity cannot cover the need.
The local W-2 layer can also support greater continuity. Health systems can build a pool of credentialed clinicians who return to the same facilities and units, giving managers more opportunities to work with familiar clinicians instead of repeatedly onboarding new agency workers. The financial impact depends on factors such as internal fill rates, vacancy levels, overtime, turnover, orientation requirements, continuity, and current agency use.
Length of Stay Is Part of the Cost Equation
Staffing affects hospital throughput, and throughput affects length of stay. Research has found associations between higher RN staffing levels and shorter hospital stays.
A meta-analysis by Kane and colleagues found that higher RN staffing was associated with shorter stays in intensive care units and among surgical patients.
Research from Queensland also found that hospitals implementing mandated nurse-to-patient ratios experienced changes in mortality, readmissions, and length of stay. McHugh and colleagues reported that the resulting savings exceeded the cost of the additional nursing staff.
Staffing represents one factor among many that influence length of stay. Patient acuity, care coordination, physician practice, discharge processes, bed availability, and other operational factors also matter.
The financial question remains relevant. When staffing affects throughput, the impact can reach well beyond the labor budget.
What Does One Additional Day Cost?
Consider a hypothetical example. A coverage issue adds half a day of length of stay across 400 patients during a quarter, resulting in 200 additional patient-days. Those 200 days carry variable costs and consume capacity that could otherwise support new admissions.
Finance can model the impact using the hospital's own case mix, contribution margin, variable cost per patient day, and bed utilization. A relatively small difference in workforce costs can look very different once the capacity impact is factored in.
Quality and Reimbursement Belong in the Staffing Analysis
Workforce decisions also intersect with hospital quality performance and Medicare reimbursement. Several federal programs connect payment to measures that workforce stability and staffing levels can influence.
Value-based Purchasing
CMS withholds 2% of participating hospitals' Medicare fee-for-service payments and redistributes those funds based on performance across specified quality measures.
Hospital-acquired Condition Reduction Program
Hospitals that rank in the worst-performing quartile under the HAC Reduction Program receive a 1% reduction in Medicare payments.
Readmissions
The Hospital Readmissions Reduction Program can reduce a hospital's Medicare payments by up to 3% based on applicable readmission performance.
Patient Safety Events
Preventable adverse events can lead to treatment costs, increased utilization, liability exposure, and other expenses. Staffing does not explain every patient safety event, and the relationship between staffing and outcomes involves many factors. Quality and safety still belong in a complete staffing analysis because they carry financial consequences.
You can connect these measures to staffing by tracking performance alongside vacancy, turnover, overtime, fill rates, and continuity. The goal is to identify relationships within your hospital's data and understand where workforce decisions may affect financial performance.
The Risk Cost of Staffing
Risk exposure adds another dimension to the staffing equation.
Coverage, continuity, workload, experience, and team familiarity all shape the environment in which clinicians deliver care. Patient safety events can increase treatment costs and liability exposure, while malpractice claims can lead to legal expenses, settlements, and insurance costs.
Staffing doesn't automatically cause a claim or adverse event. A useful financial model recognizes the potential relationship and gives risk leaders a place in the staffing conversation.
For CFOs, the practical challenge is measurement. Claims data, safety events, staffing levels, overtime, turnover, and unit-level workforce data can help identify patterns that deserve closer analysis.
How to Calculate the True Cost of Contingent Labor in Healthcare
Healthcare organizations can build a defensible view of the true cost of contingent labor by evaluating each workforce model across the same categories.
Step 1. Calculate Direct Labor
Include bill rate, hours, overtime, differentials, agency fees, wages, taxes, and benefits.
Step 2. Calculate Staffing Friction
Include recruiting, credentialing, orientation, onboarding, turnover, vacancy coverage, and scheduling costs.
Step 3. Calculate Operational Impact
Include length of stay, capacity utilization, delayed discharges, productivity ramp, and vacancy-driven overtime.
Step 4. Calculate Quality and Reimbursement Impact
Include applicable value-based purchasing, HAC Reduction Program, and readmission impacts.
Step 5. Calculate Risk
Include patient safety events, liability, malpractice, and other preventable-event costs where the organization can establish a reasonable financial connection.
Step 6. Compare Models Using the Same Measures
Put workforce models side by side and use your hospital's data wherever possible.
Cost Category | Internal Workforce | Local W-2 Labor | Agency |
|---|---|---|---|
Direct Labor | Yes | Yes | Yes |
Agency Markup | No | Price Transparency | Yes |
Credentialing | Yes | Yes | Yes |
Turnover | Varies | Varies | Varies |
Continuity | High | Medium | Low |
Operational Impact | Varies | Varies | Varies |
Quality Impact | Varies | Varies | Varies |
Your team should compare the full set of costs for each model and use actual organizational data to fill in any gaps.
Why the Lowest Hourly Rate May Not Be the Lowest-Cost Model
Consider these two staffing scenarios:
Scenario A offers a lower bill rate but experiences higher turnover. The hospital spends more time recruiting and orienting replacements, relies more heavily on overtime, and gets less continuity from its contingent workforce.
Scenario B carries a higher hourly cost and produces greater worker continuity. The hospital spends less time replacing and orienting workers and may reduce some of the friction associated with the constant turnover of contingent staff.
The relevant question for hospital labor cost management is which model produces the stronger total economic result after the organization accounts for all affected cost centers.
The answer will vary by hospital. A facility with high turnover and heavy agency utilization may see a different result from a facility with stable staffing and low contingent labor use.
What CFOs Should Look for in a Workforce Partner
As you evaluate workforce partners, it's critical to examine the operating model behind the hourly rate.
1. W-2 Employment
The employment model affects how the partner employs, supports, and manages its workforce. CFOs should understand the associated costs, responsibilities, and accountability.
2. Credential Verification
A partner should maintain a clear process for verifying credentials and confirming worker readiness. Efficient credentialing can reduce administrative work and help facilities fill open shifts with qualified workers.
3. Repeat-worker Continuity
A staffing partner that brings the same workers back to the same facilities can reduce some of the friction associated with constantly introducing new contingent staff. CFOs can measure the effect through repeat-worker rates, orientation hours, fill rates, and unit-level performance.
4. Economics Visibility
A workforce partner should provide data that helps leaders understand staffing performance. Useful measures include fill rate, hours, overtime, turnover, repeat-worker rate, time to fill, vacancy, and utilization. Hospitals can then compare workforce metrics with operational and quality measures.
The CFO Takeaway
Bill rate matters because it’s one of the most visible staffing costs on the hospital P&L. It’s also one of the easiest to compare.
The bigger picture takes more work to see. Turnover drives recruiting and onboarding costs. Vacancies can increase overtime and contingent labor. Staffing levels can affect throughput and length of stay. Quality and patient safety can affect reimbursement, claims, and other costs.
CFOs can bring these factors into the same analysis and compare workforce models based on the measures that matter most to their organization.
ShiftMed’s model gives hospitals several areas to measure, including W-2 employment, credential verification, and repeat-worker continuity. Hospitals can look at those factors alongside their own turnover, orientation, vacancy, overtime, utilization, and quality data.
The hourly rate is where workforce decisions start. The full cost of the workforce model shows where it ends.
Related Articles
Sources
1. American Hospital Association, Costs of Caring 2026 (workforce ~60% of hospital expenses; >$1 trillion on workforce in 2025). https://www.aha.org/costsofcaring
2. 2026 NSI National Health Care Retention & RN Staffing Report, as reported by Becker’s Hospital Review ($60,090 avg. RN turnover cost; ~$295,000 per 1% change; $5.19M avg. annual loss; 17.6% RN turnover). https://www.beckershospitalreview.com/workforce/the-cost-of-nurse-turnover-in-10-points-2026/
3. Aiken LH, et al. Hospital nurse staffing and patient mortality, nurse burnout, and job dissatisfaction. JAMA, 2002;288(16):1987–1993 (7% mortality increase per added patient). https://pubmed.ncbi.nlm.nih.gov/12387650/
4. Kane RL, et al. The association of registered nurse staffing levels and patient outcomes. Medical Care, 2007;45(12):1195–1204 (LOS shorter by 24% ICU / 31% surgical). https://pubmed.ncbi.nlm.nih.gov/17764206/
5. McHugh MD, et al. Effects of nurse-to-patient ratio legislation on nurse staffing and patient mortality, readmissions, and length of stay. The Lancet, 2021;397(10288):1905–1913 (savings > 2x cost of added nurses). https://www.thelancet.com/journals/lancet/article/PIIS0140-6736(21)00768-6/fulltext
6. CMS, Hospital Value-Based Purchasing Program (2% withhold, by law). https://www.cms.gov/medicare/quality/value-based-programs/hospital-purchasing