Healthcare Workforce Surge Planning: Why Response Speed Beats Better Forecasting


Almost every healthcare workforce leader has lived through some version of the same January: census climbs right after New Year's, the float pool is gone by day four, and by week three, agency rates cover shifts that could’ve been circled on the calendar back in November.
The surge wasn't a total surprise. A trend started showing up on day two, but it still took 11 days to act. Sit through enough post-peak reviews and the same pattern shows up: the conversation turns to forecasting. We need a better model. We need to see it coming sooner.
While forecasting matters, the bigger opportunity is shortening the gap between spotting a workforce need and filling the shift, which is where speed protects your margin.
Call it surge-response lag: the time between identifying a workforce need as patient demand rises and getting the right clinicians in place. Measure it, and you can shorten it, giving you more time to act before premium labor becomes the only answer.
Healthcare workforce surge planning gives leaders a real-time view of available capacity, making it easier to spot gaps early and deploy the right clinicians before costs escalate.
Why Hospital Census Fluctuations Outpace Traditional Staffing Plans
Respiratory season doesn't follow the tidy, predictable shape it once did. Peaks land at different times from year to year, overlapping waves show up instead of neatly sequential ones, and the timing is harder to call in advance than it used to be.
Meanwhile, a typical annual hospital staffing plan assumes the season will behave as expected. You set FTE targets against an expected curve back in the spring, build the budget around it, and then winter shows up looking nothing like the plan. The gap has less to do with planning skills and more to do with timing. A fixed number set six months out can only track a demand pattern that holds its shape, and demand stopped holding its shape a while ago.
So, you've got variable demand meeting fixed capacity, every year. The hospitals and health systems that hold their margin through a peak have all landed on the same idea. Some portions of their workforce must have the flexibility to move as quickly as demand does.
The Forecasting Ceiling
A perfect two-week forecast doesn't help when it takes six weeks to hire and credential a nurse. Knowing what's coming and being able to respond are two different things. Many hospitals have spent years sharpening forecasts while the response side quietly capped performance. Once a forecast can size the season, speed is the real gain, and speed is the part you can build.
The Metric Nobody Measures
Surge-response lag remains invisible because it spans multiple teams, and no single report shows it end-to-end. Each team sees its own piece, and every piece looks fine on its own. Nobody's timing the total, so it quietly runs into double-digit days. When you break down lag in stages, you can see where the time goes.
Detection lag: how long it takes before someone can see a trend.
Broadcast lag: how long it takes to put open shifts in front of eligible clinicians.
Commitment lag: how long it takes before a qualified clinician claims a shift.
Decision lag: how long it takes to get premium pay, agency use, and float moves approved.
The Typical Cost of Surge-Response Lag
Put a rough day count next to each stage, and you can diagnose your surge-response lag in an afternoon.
Detection eats up a day or more when census is your only trigger.
Broadcast runs a full day or longer if you're working from a phone list.
Commitment runs from minutes to a day, depending on shift visibility.
Decision adds several days when the approvals aren't lined up in advance.
Add up the numbers, and one thing stands out. Most of that time is recoverable through process and visibility, enough to take up to 40% off your total surge-response lag. Forecast accuracy can't match that, because prediction hits a ceiling set by biology and human behavior. Speed is the part you control, and most teams spend their energy on the forecast instead.
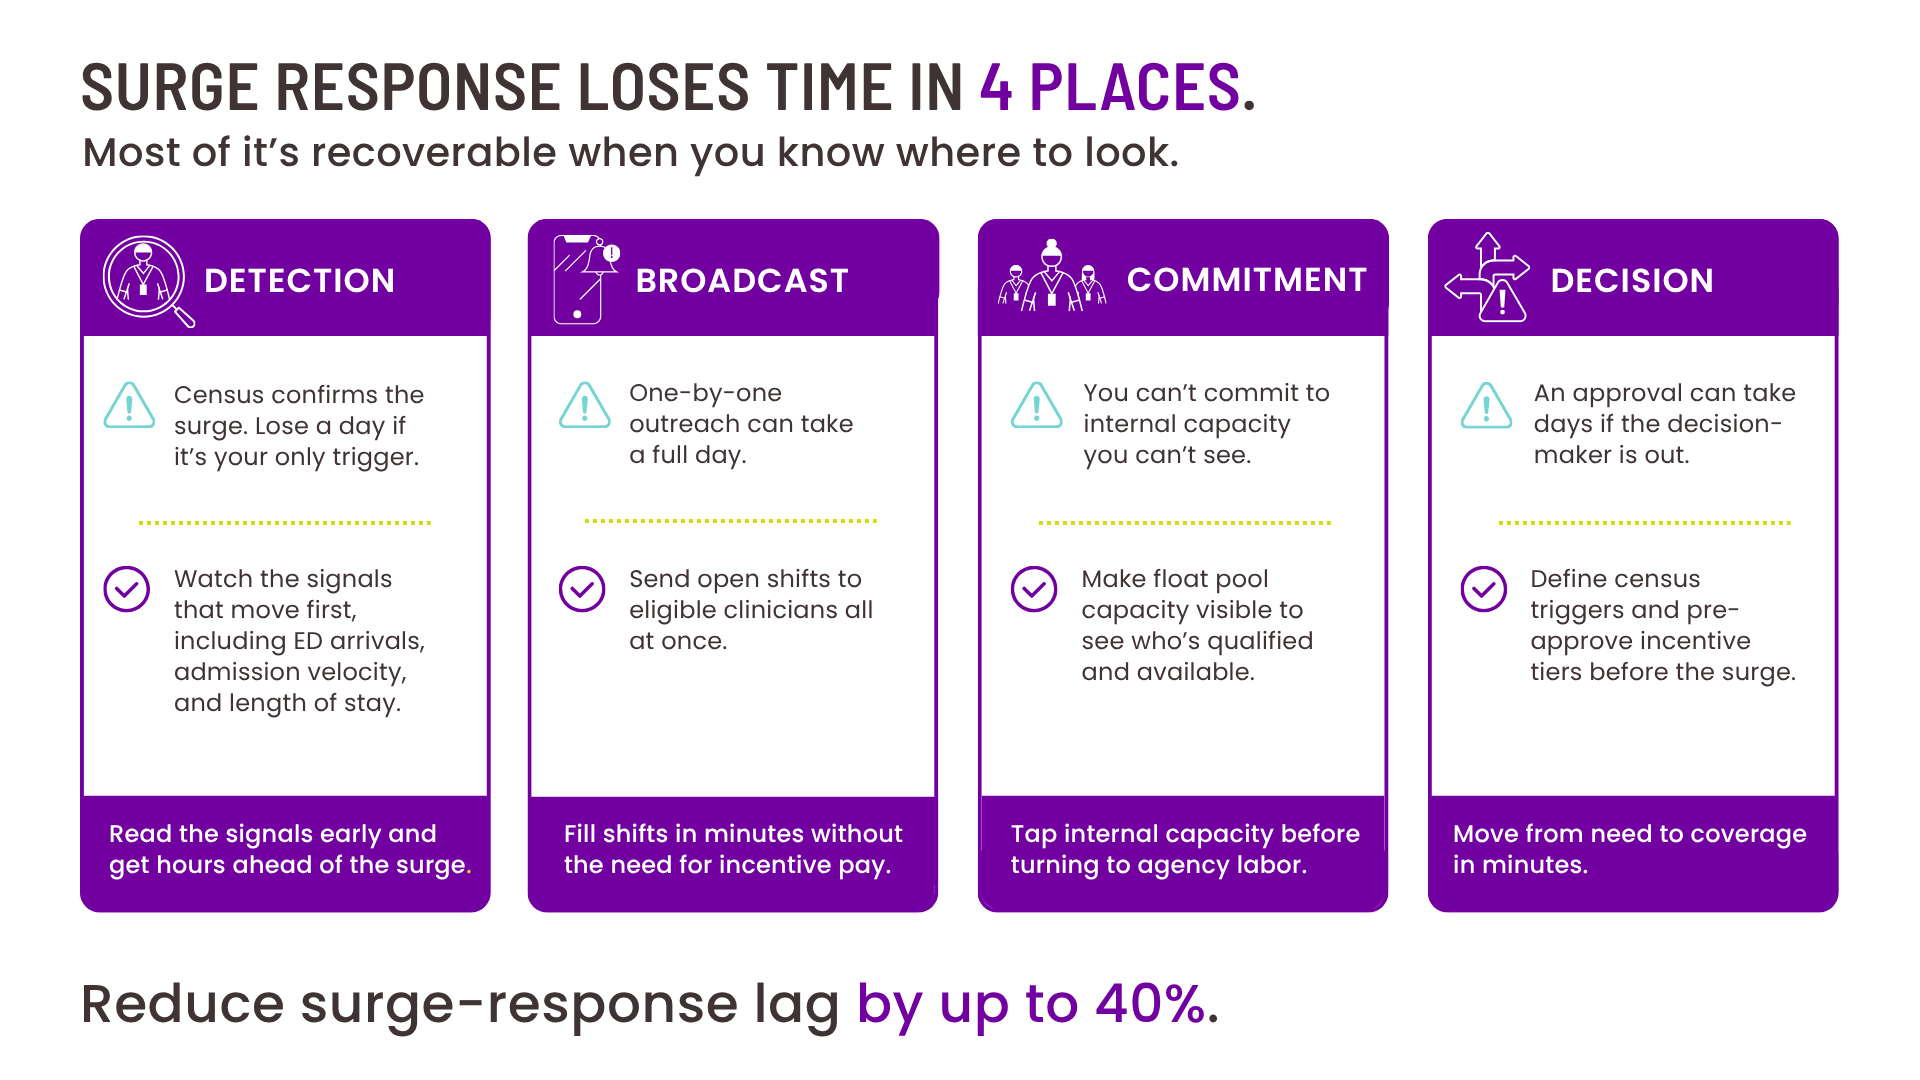
4 Ways Lag Hides in Healthcare Workforce Operations
Every stage of surge-response lag has a point where time disappears. Once you know where to look, most of it is recoverable and cheaper to fix than you'd guess.
1. Detection: You're Watching the Wrong Signal
By the time the census moves, the surge is on top of you. The early signals sit upstream: ED arrival volume, admission velocity, and the slow creep in average length of stay. All of them move before the census does. Watch them, and detection lag drops from days to hours because you're reading the surge as it builds rather than after it peaks. The data usually already lives in your systems. What's missing is getting it in front of the right person in time to act.
2. Broadcast: Getting the Shift in Front of Everyone at Once
Most hospitals still fill surge shifts by calling names from a list one at a time, which can take a full day. The nurse who'd have said yes at hour two doesn't get the call until hour 20, and by then the shift is headed to an agency. When you can send open shifts to every eligible worker at once, the delay virtually disappears. You’re dealing with the same people, shifts, and pay. All that changes is the speed at which clinicians see these openings. Not to mention, broadcast is usually where the quickest, cheapest wins are.
3. Commitment: The Float Pool You Can't See
You've got an internal float pool of PRN staff and part-timers who'd happily pick up extra shifts. Most of them are invisible to your scheduling system, so schedulers can't see who's available, who's credentialed for what, and who's open to extra hours. The internal capacity you already pay for goes unused, and open shifts default to higher-cost agency labor. When you close the visibility gap, the same pool becomes capacity you can deploy the moment a shift opens.
4. Decision: The Approval Chain Nobody Set Up in Advance
Half the time, premium pay and agency sign-off route through someone who isn't in the building when the surge hits. Therefore, a decision that should take an hour ends up waiting until Monday. Set your escalation tiers ahead of time, and a multi-day wait becomes a same-day response. Decide now that when the census crosses a defined line, tier-one premium pay is approved, and the scheduler can move. Make the decisions before the pressure lands, and the decision stage mostly takes care of itself.
What Healthcare Workforce Forecasting Still Does
Forecasting still earns its keep in healthcare workforce surge planning because speed can only move capacity that already exists. Forecasting sets the stage by helping you answer questions such as:
How big should I build my internal float pool?
How many clinicians need cross-training?
How much premium-pay budget do we hold back?
A good forecast answers these pre-season questions months out. Do the homework, and in-season speed has something to work with. Skip it, and there's nothing there to move.
There's a harder limit, too. If regional labor supply is tapped out, speed can't invent a nurse who doesn't exist. Speed decides who gets the available worker first. When you and three neighboring systems fish the same pool, the first fair offer wins.
A workforce partner like ShiftMed can widen the pool you're able to reach, so more of the available supply is visible to you when a need appears. They take the shift that reached them first and paid right, and everyone else picks up the phone.
The Workforce Economics of a Slow Response
A slow response to surges carries a price, and it lands on the labor line where the board pays attention.
Premium spend comes first. Agency coverage costs more the later you book it. A shift filled three days out from your float pool and the same shift filled twelve hours out through an agency are two very different numbers, and the expensive one repeats all season.
Overtime comes next. Mandatory OT stacks up over weeks of pressure and lands in the Q1 numbers as a variance nobody budgeted for. It feels unavoidable in the moment and adds up fast.
Turnover is the one that really hurts. A hard January leads to resignations in February and March, and every replacement incurs recruiting and orientation costs that make premium pay look like a rounding error. A slow response costs you this quarter and thins the pool you're counting on for the next peak.
Respiratory season is a workforce cost event as much as a clinical one. The clinical side gets attention while it's happening. The financial side shows up later, quieter, and bigger. Shortening the lag protects the operating margin and workforce stability simultaneously, which is why the conversation belongs above the department level.
How to Measure Your Surge-Response Lag
You can quickly size up your surge-response lag using existing data to answer these four questions:
Last peak, what was your median time-to-fill for shifts opening inside 48 hours?
What share of your surge shifts got filled internally versus by agency?
How many hours passed between your census threshold and the first premium-pay approval?
What percentage of your eligible internal pool saw each open shift?
Answering these questions puts the picture into focus fast, because each number points to a specific stage. A big internal-versus-agency gap points to visibility. A long approval delay points to decision lag.
A low share of the pool seeing shifts points to broadcast. The 48-hour time-to-fill is basically all four added together, which makes it your best single headline number.
Pro Tip: Score yourself against your own last season, not against a maturity model. Year-over-year is the comparison that moves people in an operating review, and it's the one you can influence before the next peak. Run these four numbers, and you'll know within a day where your time is going.
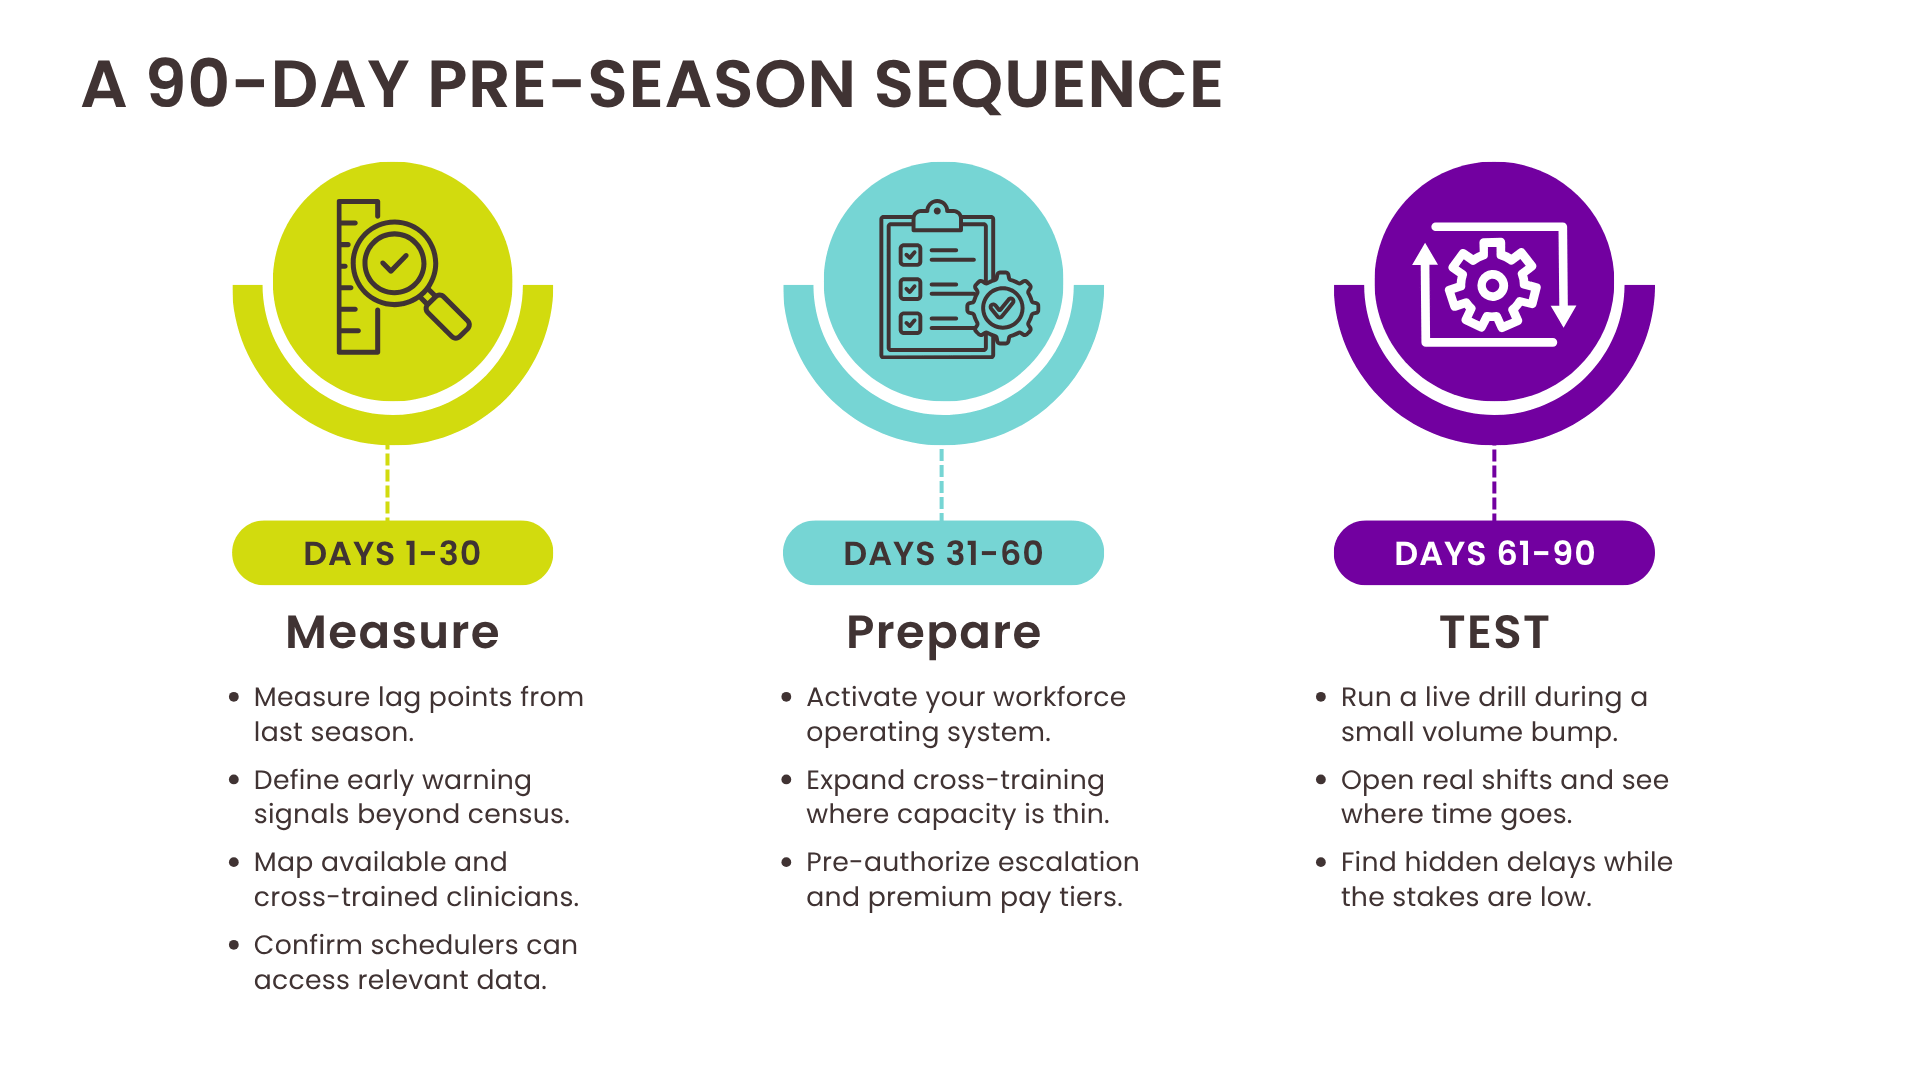
A 90-day Pre-season Sequence
Every stage above is measurable, and each one responds to work you can start now. The work of shortening all four stages sorts into three months before the season starts.
Measure: Days 1-30
Pull your four numbers from last season, one for each stage of lag, and take an honest inventory of your pool. Who's cross-trained, who's PRN, who's picked up extra shifts before? Then check whether that information is stored somewhere a scheduler can access. You also settle your detection signals here, the ED and admission trends you'll watch instead of waiting on census.
Prepare: Days 31-60
Get your pool into a workforce operating system like ShiftMed that reaches every eligible clinician at once, which is where broadcast lag collapses. Build the cross-training you flagged as thin, so more of that pool can claim a surge shift when it lands. Then pre-authorize your escalation tiers so premium-pay and agency calls are made before the pressure hits, and decision lag nearly disappears.
Test: Days 61-90
Run a live drill on a small, non-surge volume bump. Open a few shifts under real conditions and watch where the time goes. The drill is the strongest move in the plan, and almost nobody runs it. A controlled test surfaces every hidden delay while the stakes are low, so you find the stalls in October instead of January.
Turn Early Signals Into Faster Action
Census volatility used to be a winter story. It runs year-round now, with off-cycle surges that don't wait for respiratory season. The respiratory season is just a stress test. It exposes what's fragile in your response, and that same weakness shows up in a summer trauma surge or a regional event. Treat it as a one-off, and the weak spot stays until the next event finds it.
The hospitals and health systems that come through peaks in good shape have done the same quiet work. They shortened the distance between spotting a signal and acting on it in three ways: leading indicators instead of census, a pool they can see and reach at once, and approvals settled in advance. Each is measurable and within your control.
Forecasting tells you what's coming. Response speed decides what it costs you. The protected margin, the steadier workforce, and the calmer operating review all come from speed.